High-level visual organization
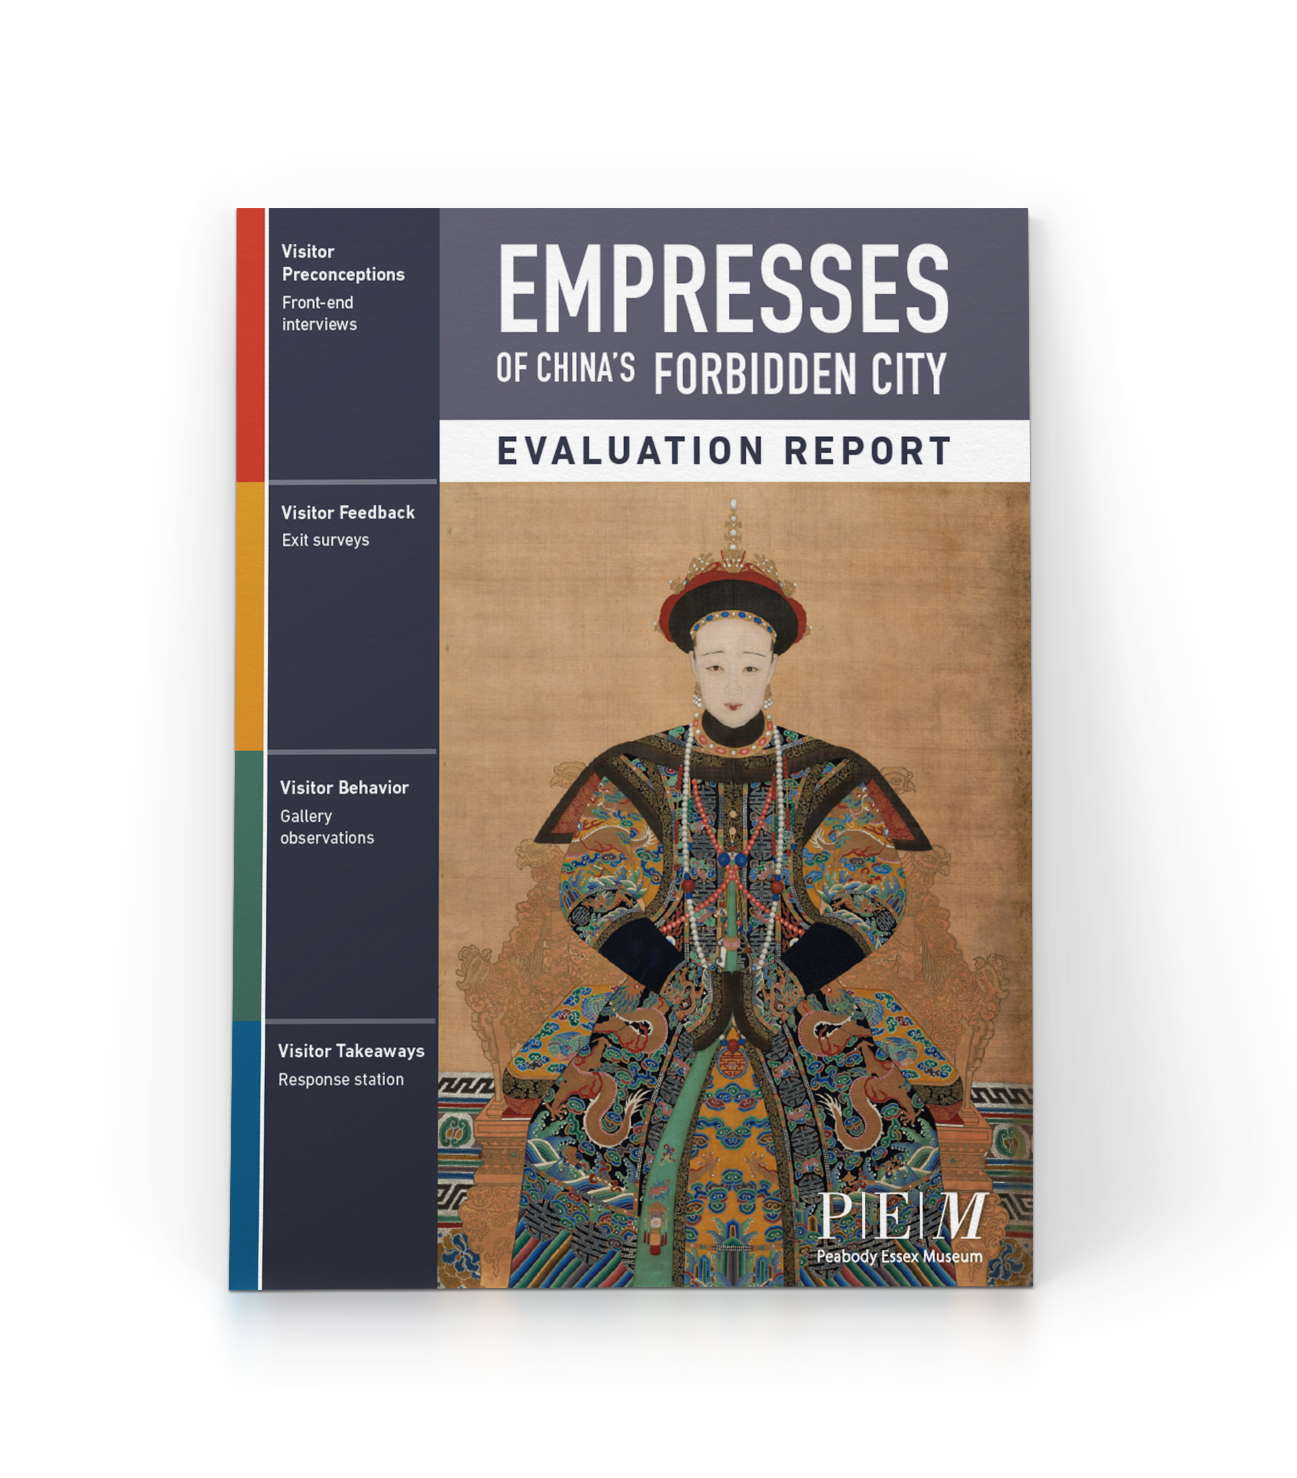
We designed an Evaluation Report for the Peabody Essex Museum (PEM)—describing the extensive evaluation that went into the Empresses of China’s Forbidden City exhibition, and the findings from their analysis. For this project we followed our typical 3 step process–Organize, Visualize, and Stylize.

Notes from our first meeting – including figuring out what the sections include and how to visualize the data.
Step 1: Organize
Our first step was to meet with the evaluation team at PEM to discuss what they wanted to include in the report and their objectives. We took the notes from that conversation and draft content to create an organized outline of the report.
Throughout this process we are looking for patterns in the information. We ask questions such as: 1) Are there defined ‘sections’ of content that make sense to visually distinguish one from another? 2) Are the sections ‘equal’ or are some more important than others? 3) Are there elements in each section that are parallel to one another? 4) What is the narrative structure (i.e. what order should the sections be in)?
In this case, there are four phases of evaluation, so we structured the report into four sections that each have an associated color.
STep 2: Visualize
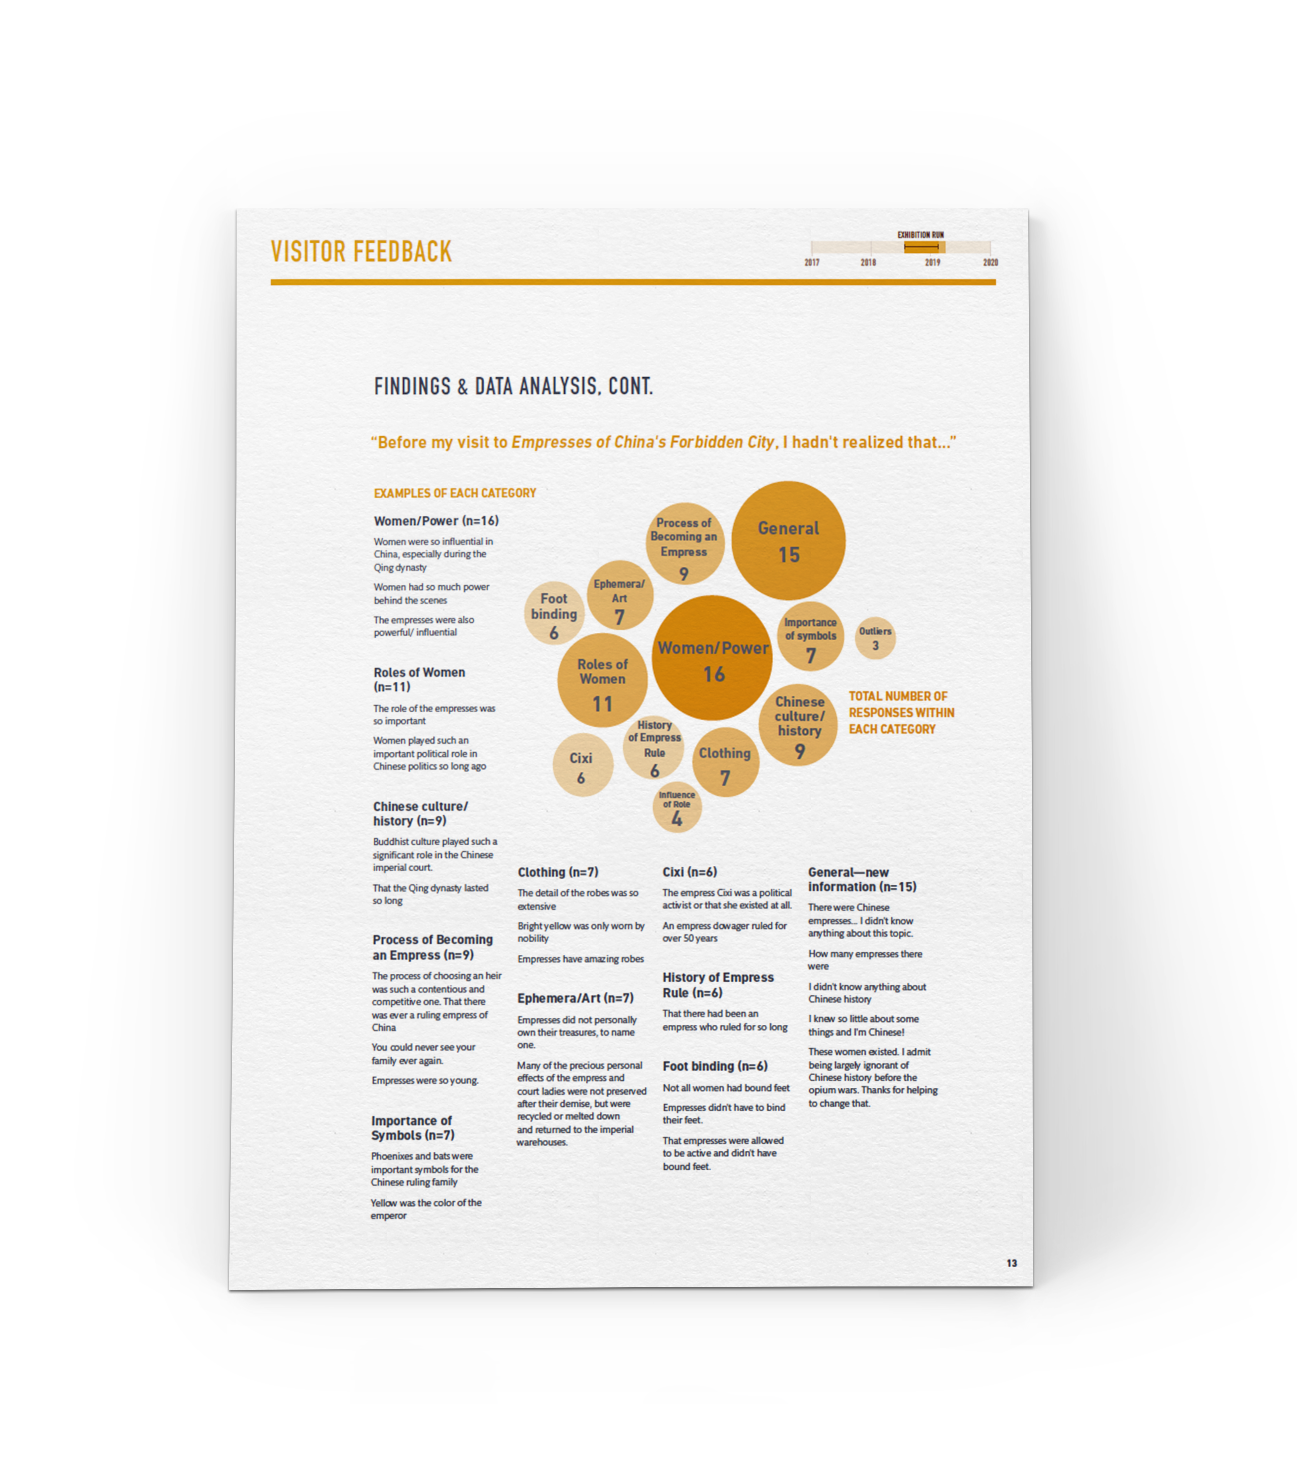
The next step involved taking the organizational outline, and using it to start sketching the layouts—including ideas of how to visualize different data points. We wanted to use a variety of visualization techniques to keep the report visually compelling.
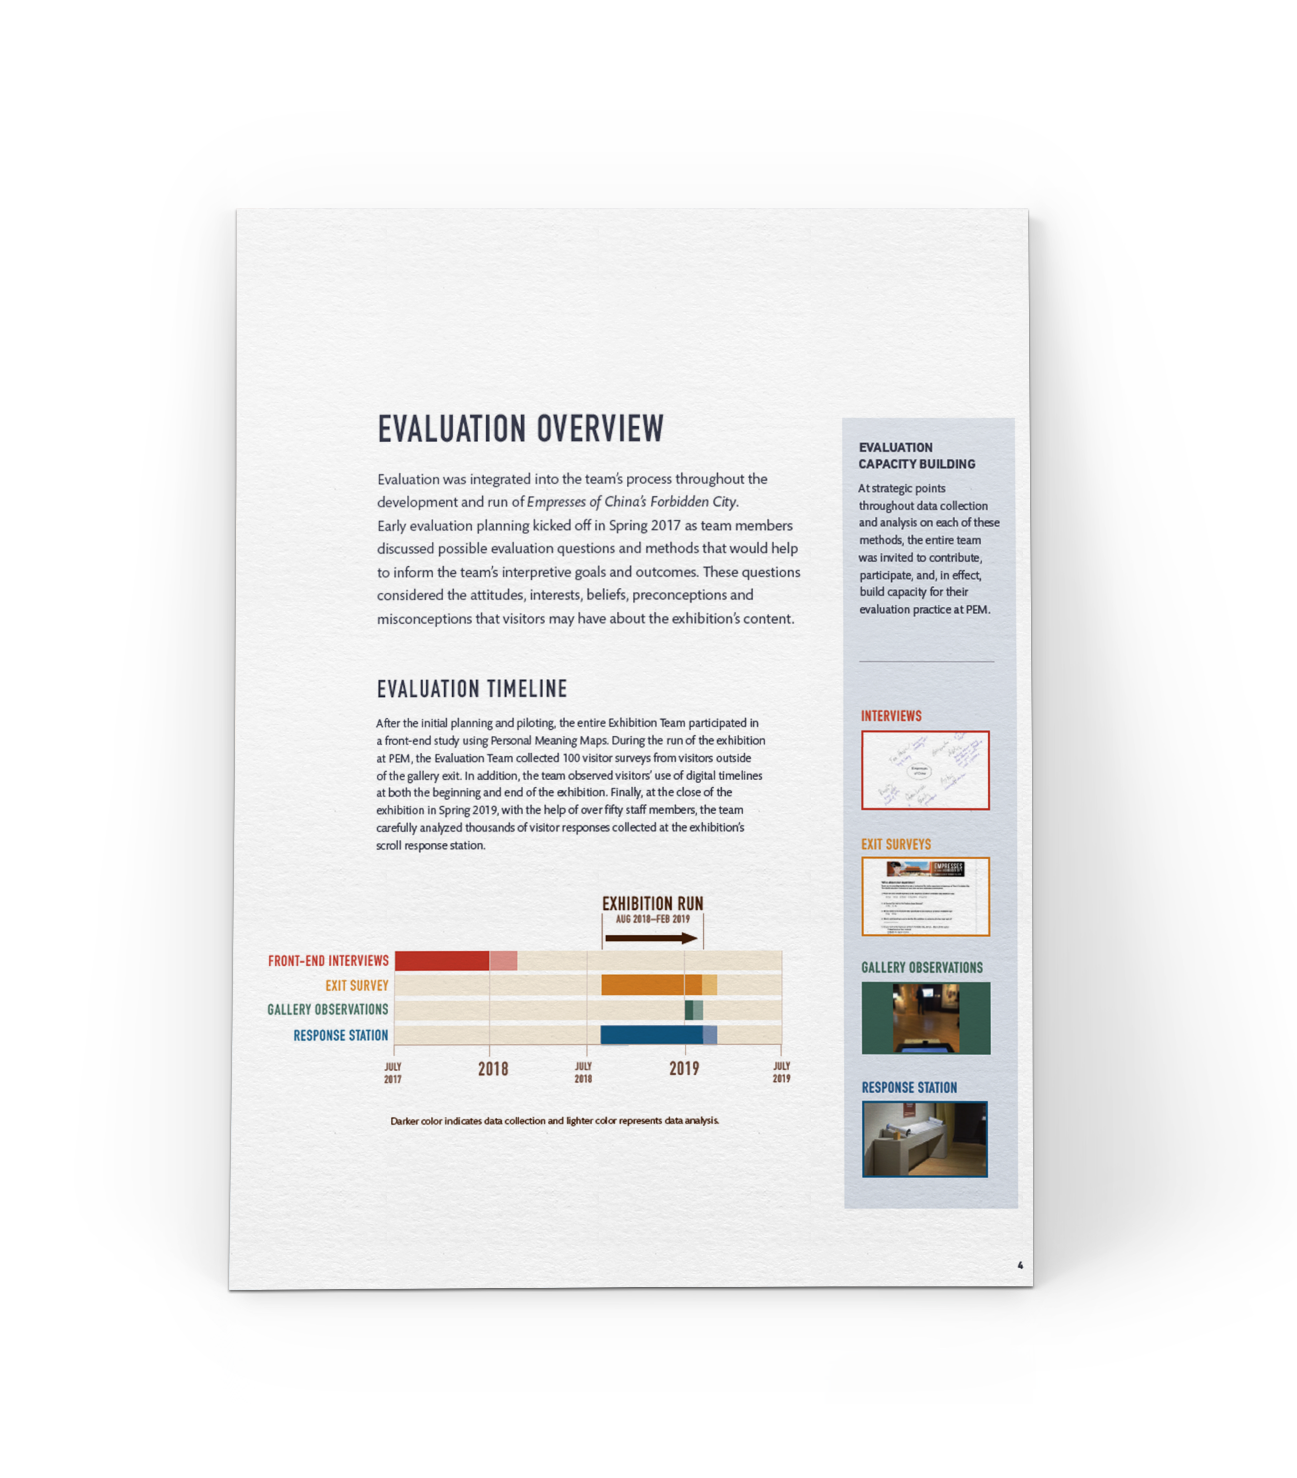
Since the basic structure of the report is based on the different phases of evaluation, one of the questions we asked ourselves was: What is a way that the whole report can be visualized/summarized in one place? We decided this would be best achieved by using a timeline. The timeline shows when and how long the different phases were relative to the exhibition run.

High-level organizing visualization—timeline of phases of evaluation
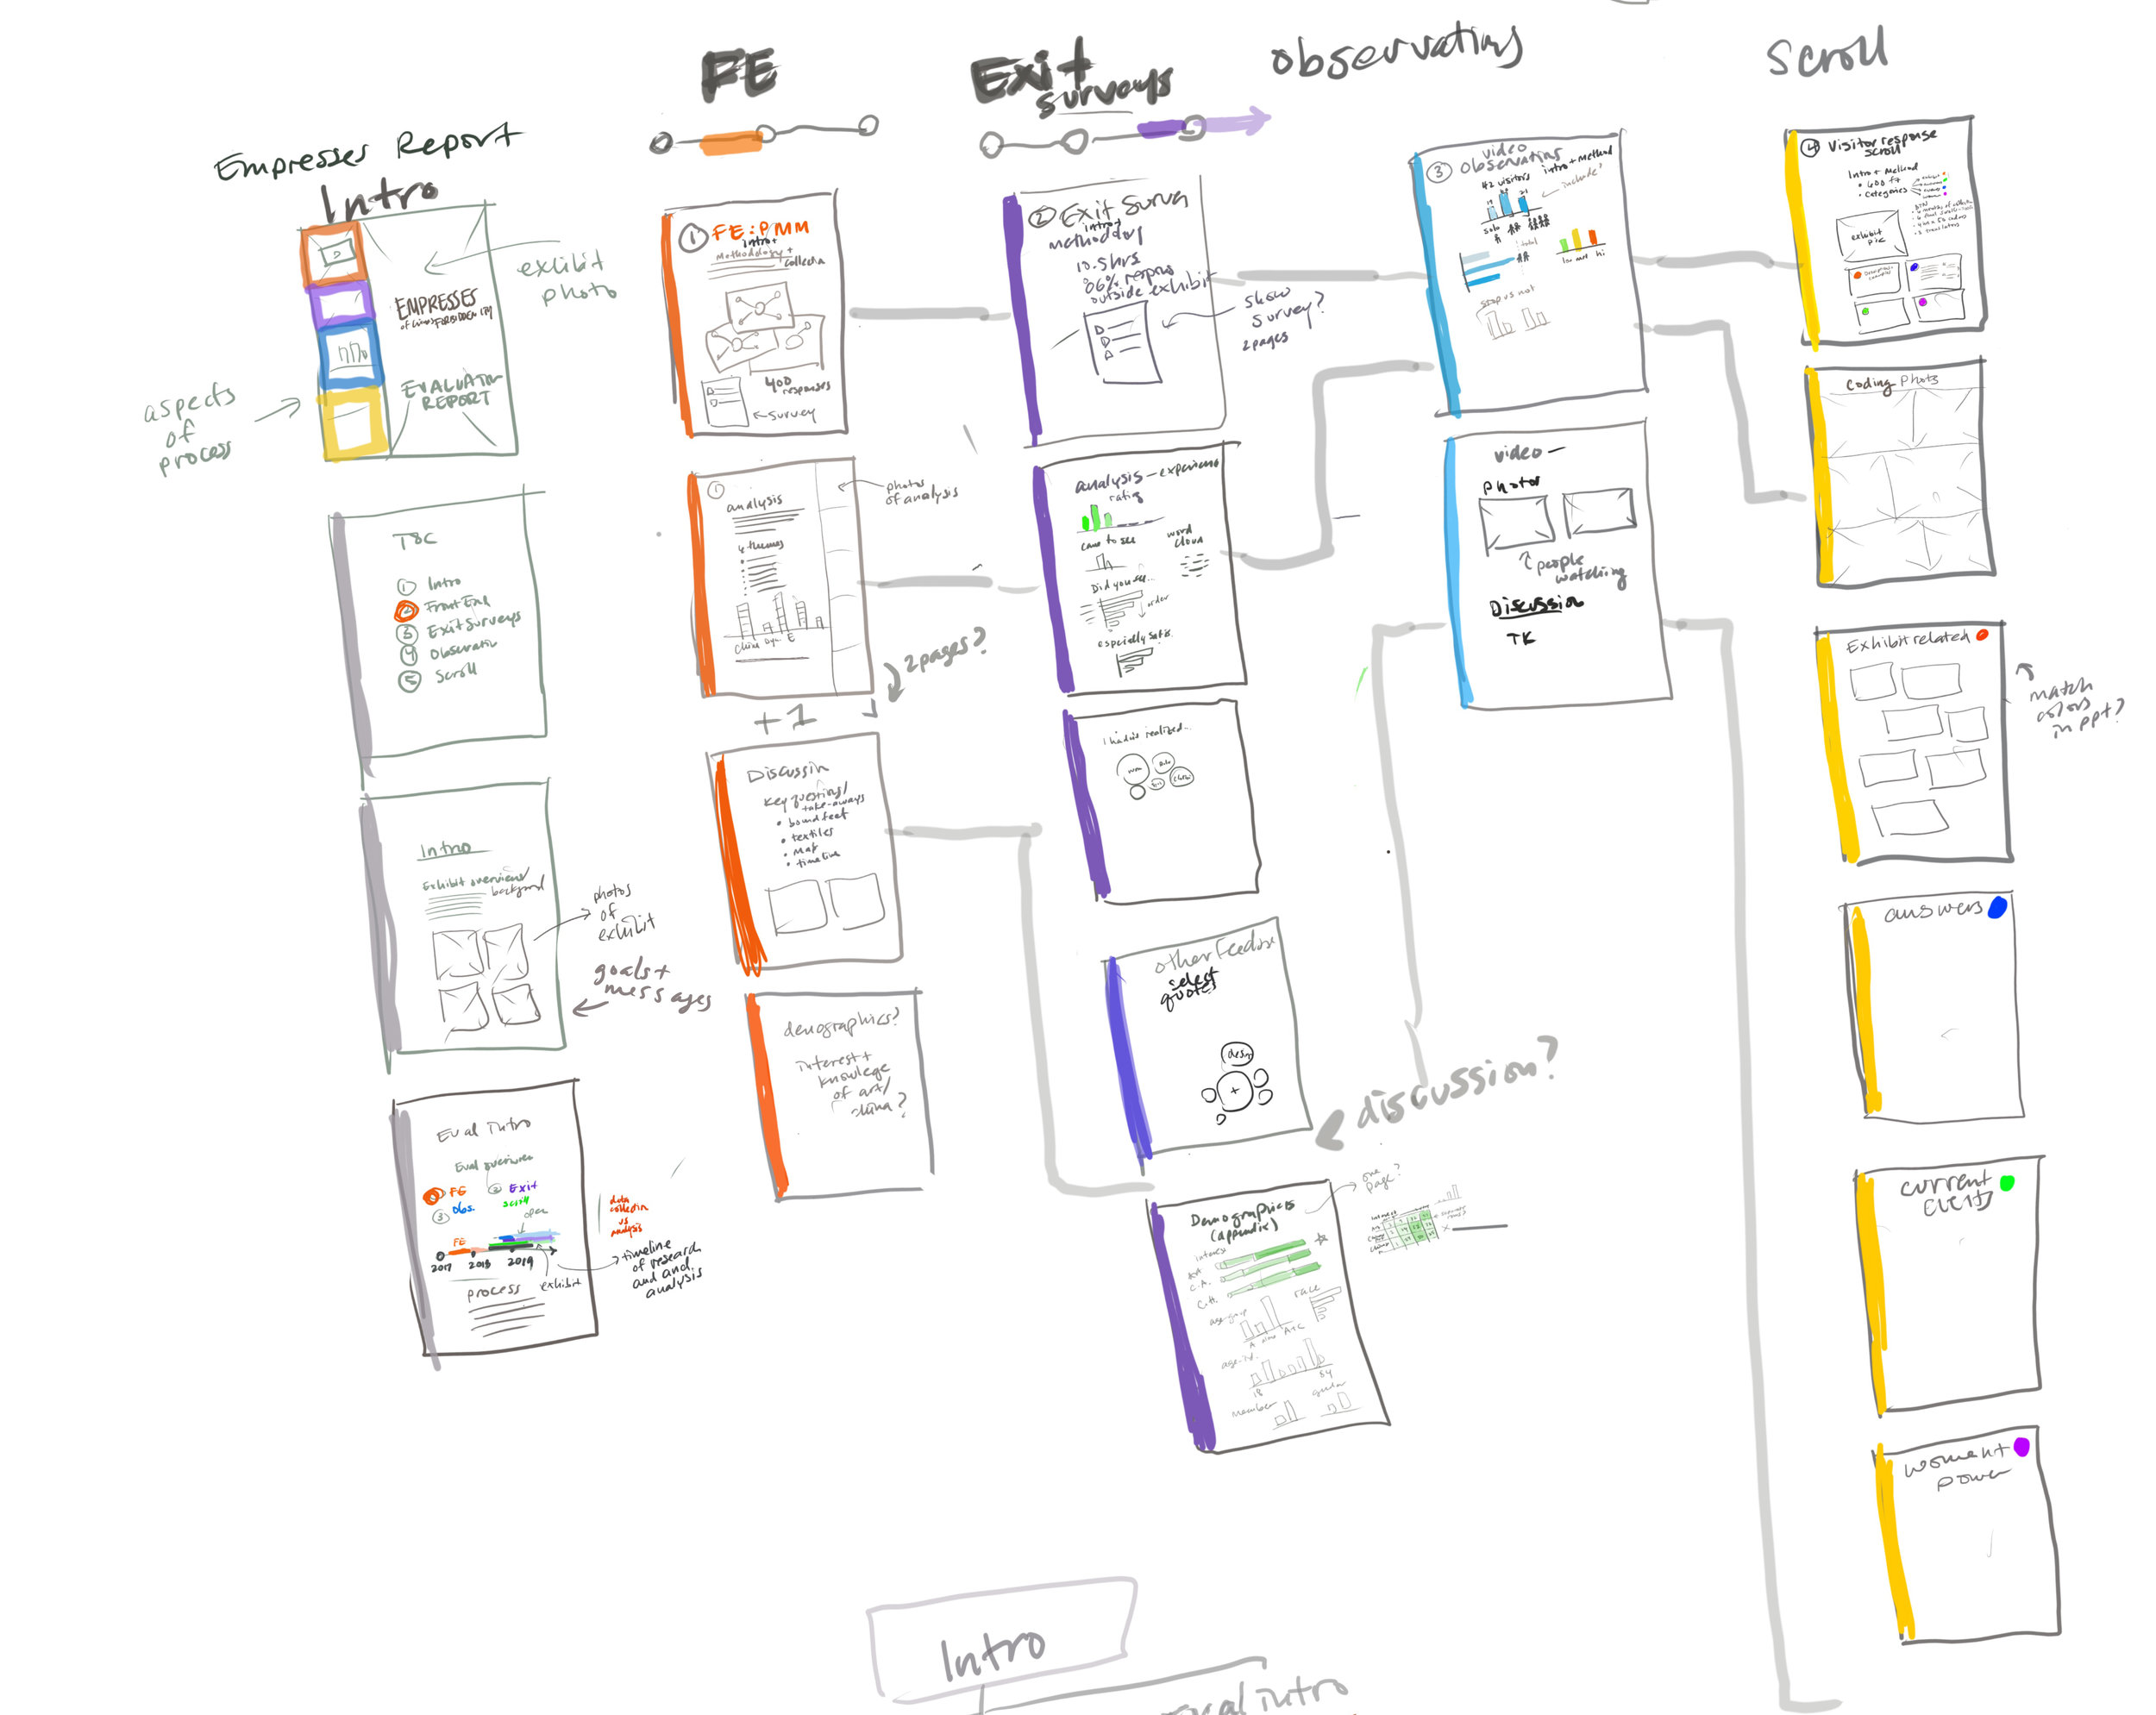
Layout sketch
Stylize
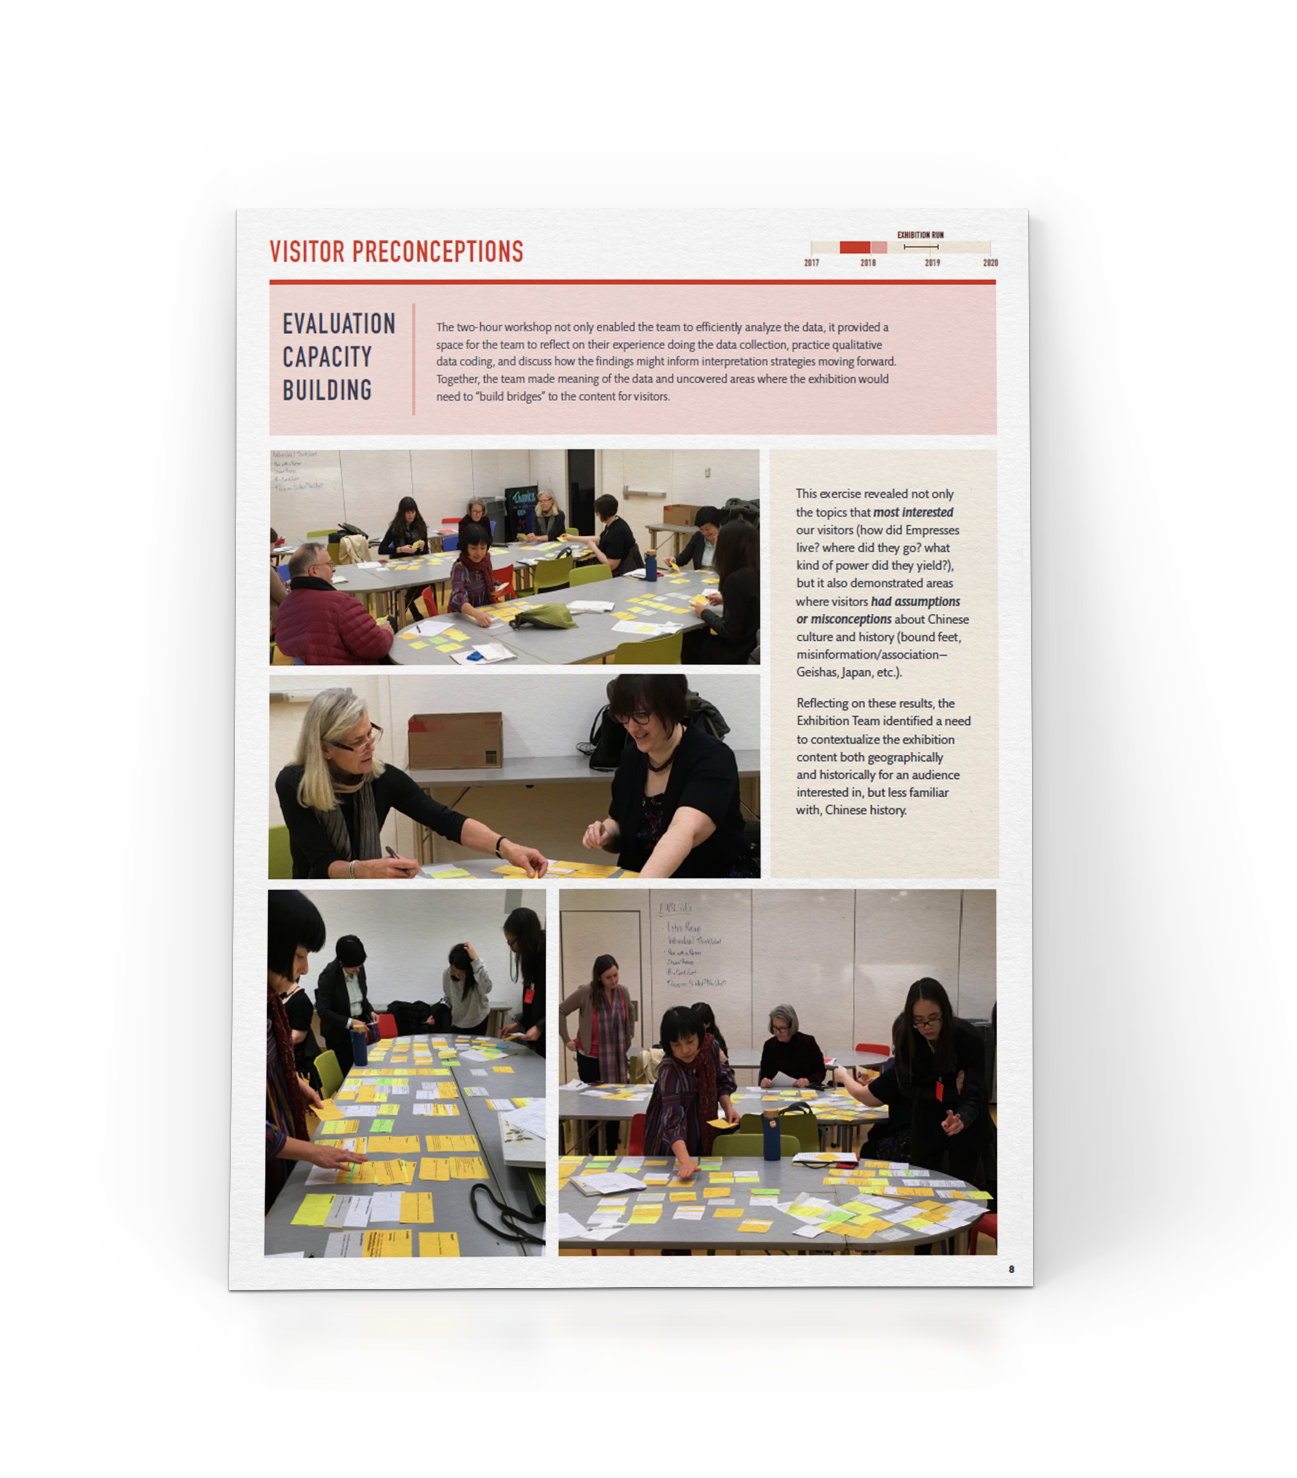
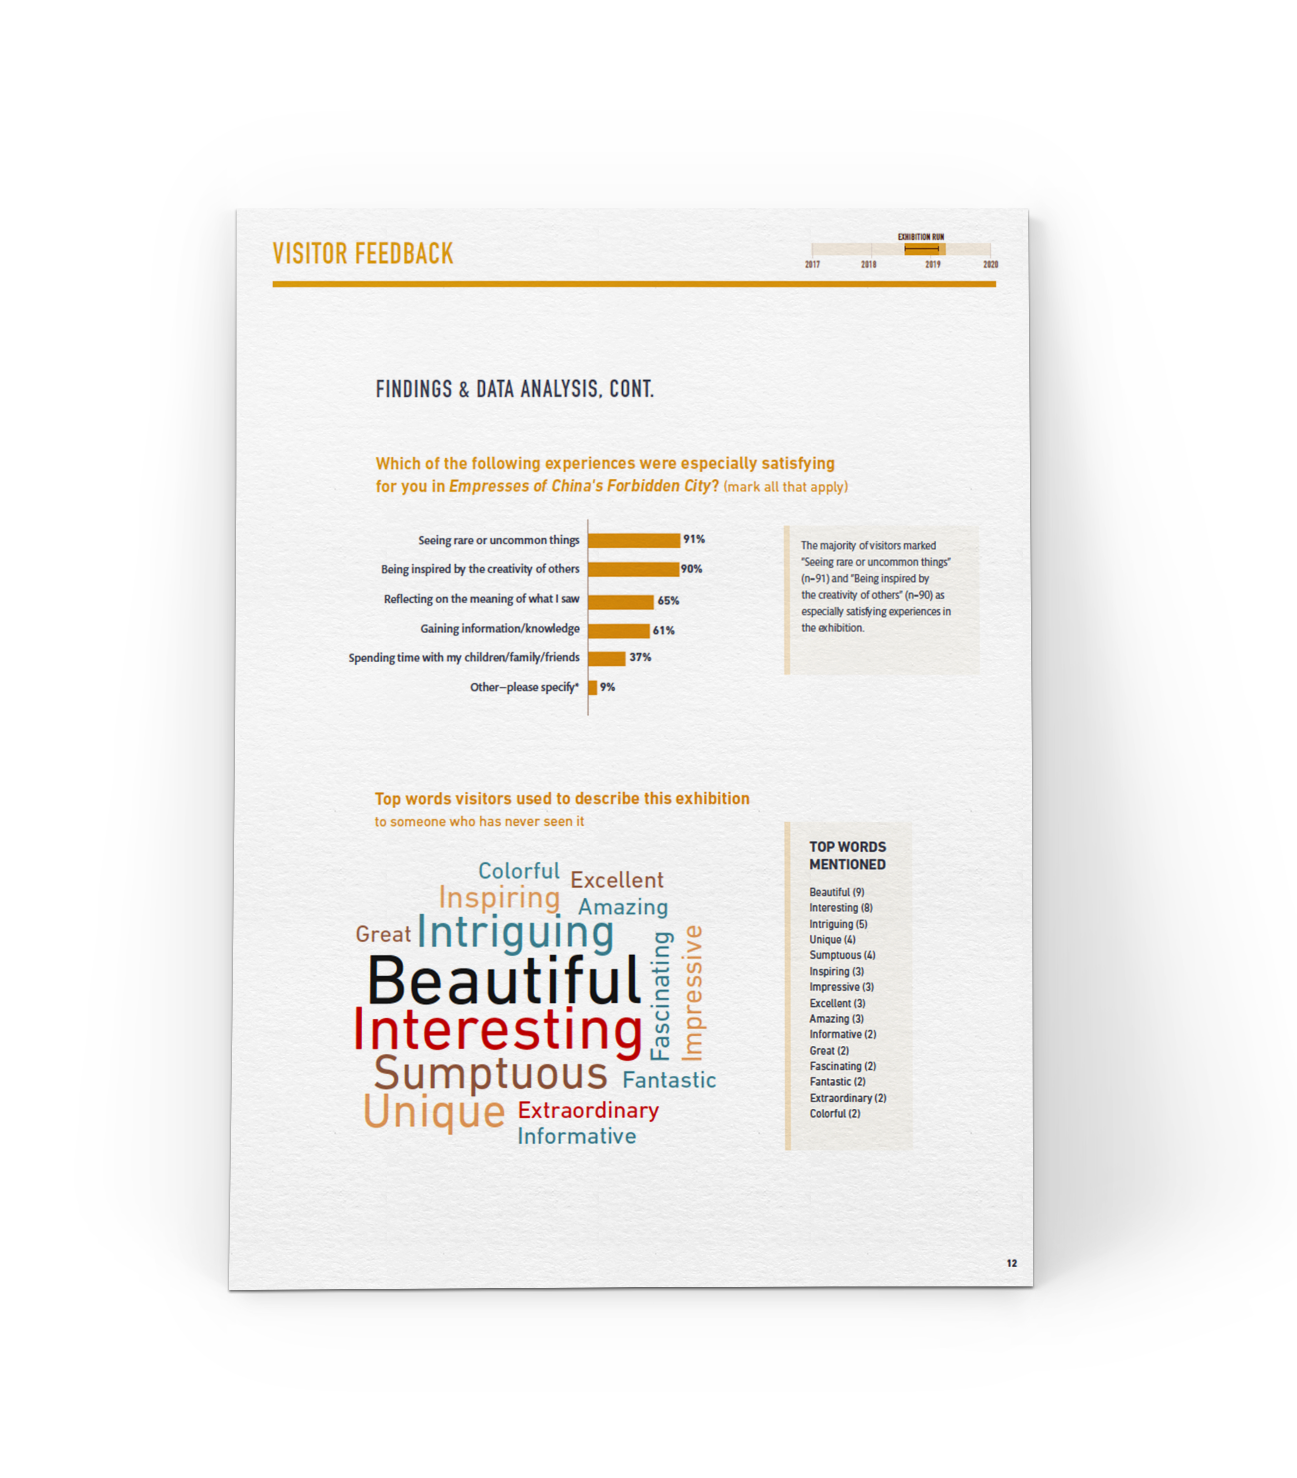
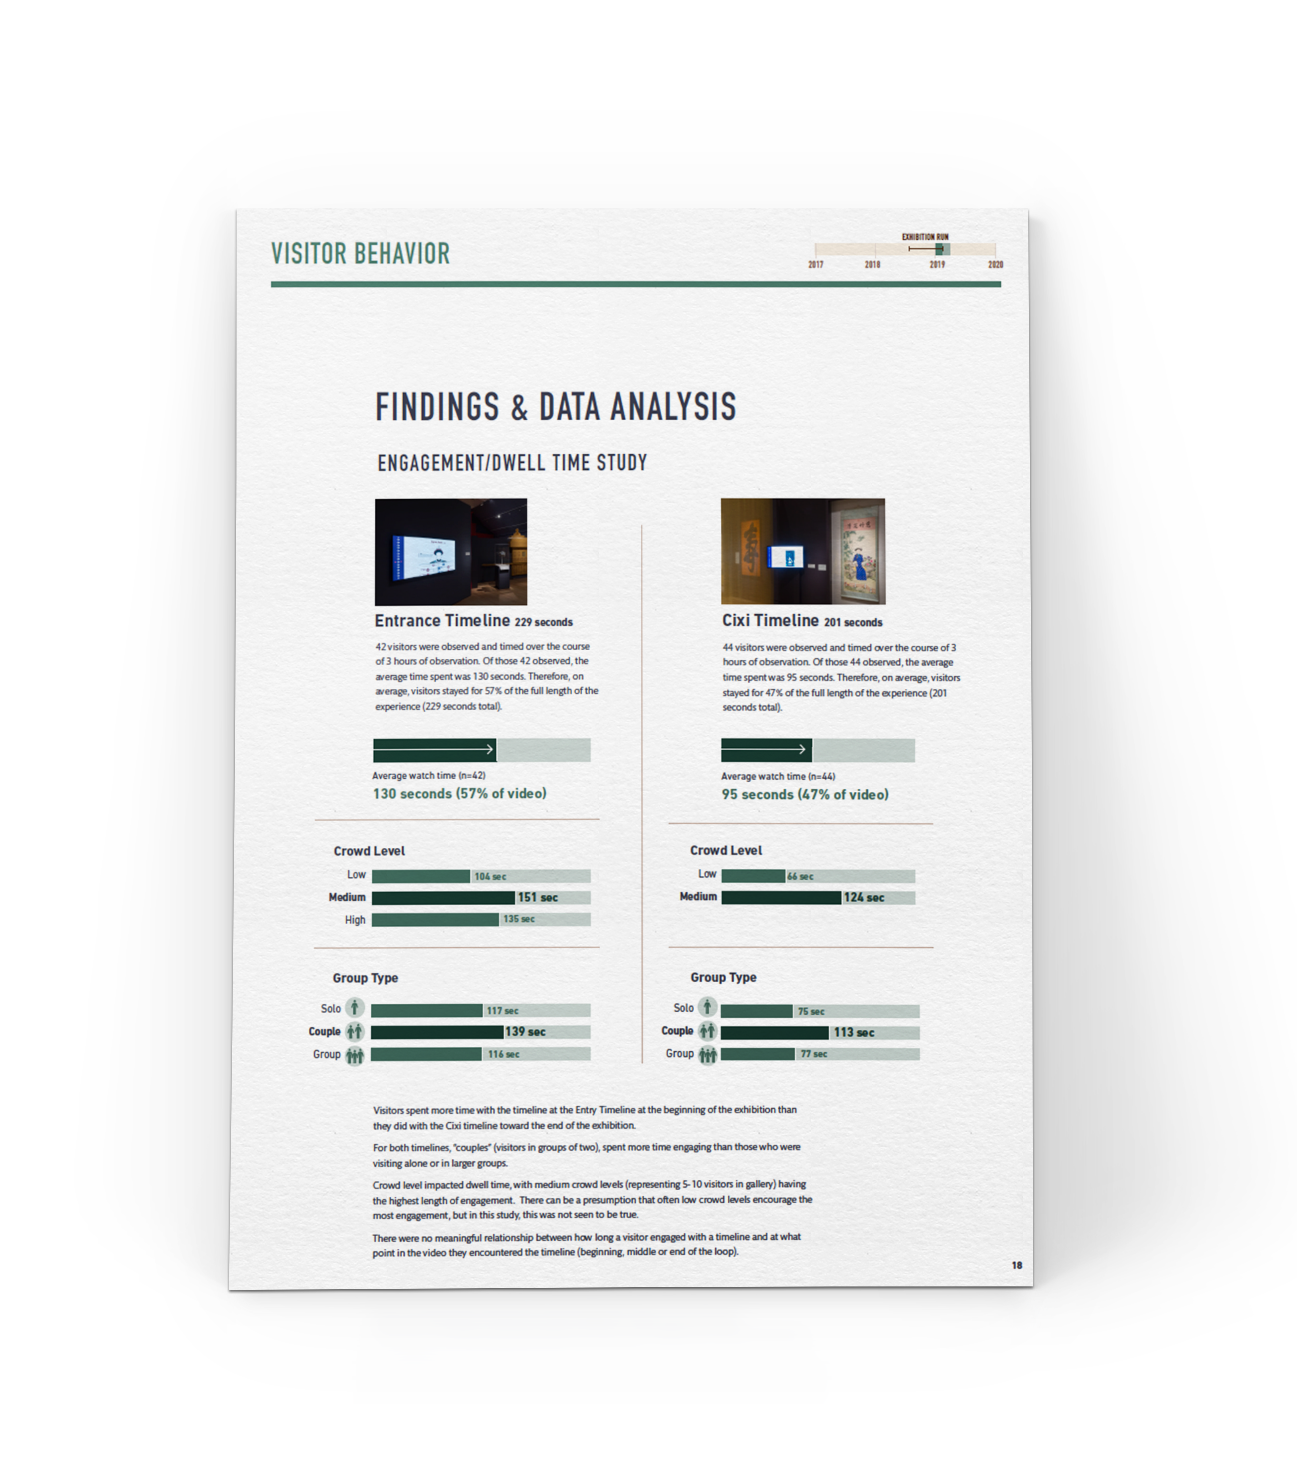
In this final step, we perfect the layouts and final graphics in InDesign, and go through multiple rounds of iterations with our client to make sure they are happy with the product. Here are some examples of final pages.
A note: this report is meant to be viewed primarily on-screen and won’t be professionally printed, so it’s set up as single pages rather than spreads.